The latest death at work figures have been produced by the HSE covering period 2015 to 2016.
 They show that the two biggest sectors in which workers have been killed remains as Agriculture and Construction.
Whilst the government are of course happy to use these figures, based as they are on RIDDOR reporting procedure which the government have manipulated and know is an inaccurate reporting method, the HSE statistics are hotly disputed by some Trade Unions, the TUC, and health and safety organisations such as Hazards and FACK.
Deaths at work this year, January 2016 to date, seem to be on the increase and it will remain to be seen whether the downward trend the HS claims for workplace deaths continues to the end of this calendar year.
Here is an excerpt from the newly published HSE statistics:
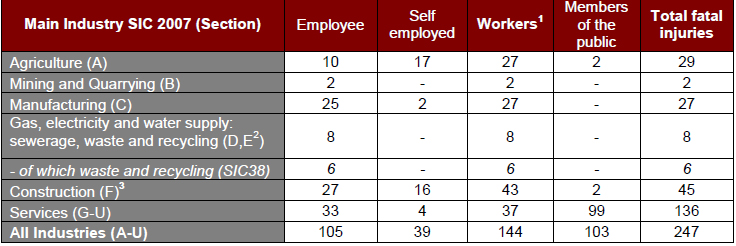
Figures by main industry sector
Tables 1 - 4 below provide the latest provisional information for fatal injuries in 2015/16, and compare these data with the previous five-year average (2010/11 to 2014/15). Note of caution – when making comparisons between industries or across years, the number of fatalities in some industries is relatively small, hence susceptible to considerable variation.
For main industry sectors in 2015/16:
* There were 27 fatal injuries to workers in agriculture, lower than the five year average of 32. The rate of fatal injury in 2015/16 is 7.73, compared to the five-year average rate of 9.40.
* In mining and quarrying two workers were killed, compared to an average of four deaths for the previous five years.
* There were 27 fatal injuries to workers in manufacturing, 23% higher than the five-year average (22). The latest rate of fatal injury is 0.92, compared to an average rate of 0.79 over the previous five years. Within the latest year, there were three incidents in this sector resulting in eight deaths, see section ‘longer-term trends’ for details.
*There were six fatal injuries to workers in waste and recycling, compared to the five-year average (7) but subject to considerable yearly fluctuations. The latest rate is 5.71 deaths per 100,000 compared to the five-year average of 5.59.
* There were 43 fatal injuries to workers in construction, the same as the five year average of 43. The latest rate of fatal injury is 1.94 per 100,000 workers, compared to a five-year average of 2.04.
* There were 37 fatal injuries to workers in services, 18% lower than the average for the past five years (45). The latest rate of 0.15 deaths compares to the five-year average rate of 0.19.
* There were 103 members of the public fatally injured in accidents connected to work in 2015/16. Of these deaths, 36 (35%) related to incidents occurring on railways (See the technical note for the effects on the statistics following recent changes to (a) railways suicide reporting, and (b) the role of the Care Quality Commission).
The whole of the 13 page report from the HSE can be downloaded from the E-Library Database here
Source: HSE